

Reports show how your support team works: how many conversations arrive, how fast your team replies and closes them, how each agent performs, how customers rate your replies, and when you are busiest. Use them to plan staffing and to find slow replies. You can also build a dashboard with only the charts you need.
reports:read (Reports Read) · Who has it by default: Account Owner and AdministratorsBefore you begin
You are the Account Owner, an Administrator, or a teammate who has the Reports Read capability. The User role does not have it by default.
Your inboxes have conversations in the period you want to see.
Where to find it
Select Report in the left rail. Reports opens on the Overview page.
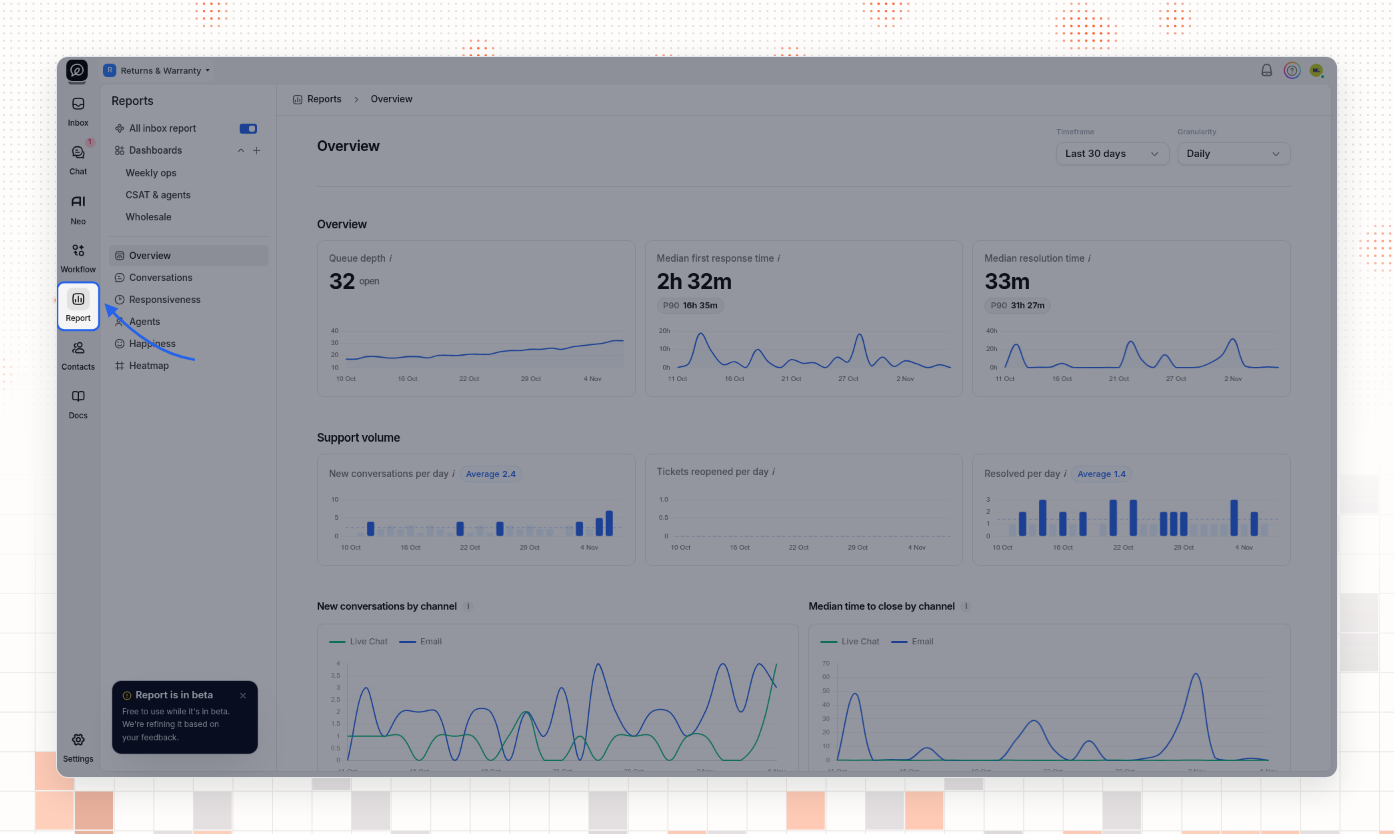
Choose what the reports show
The Reports sidebar holds every page and every dashboard.
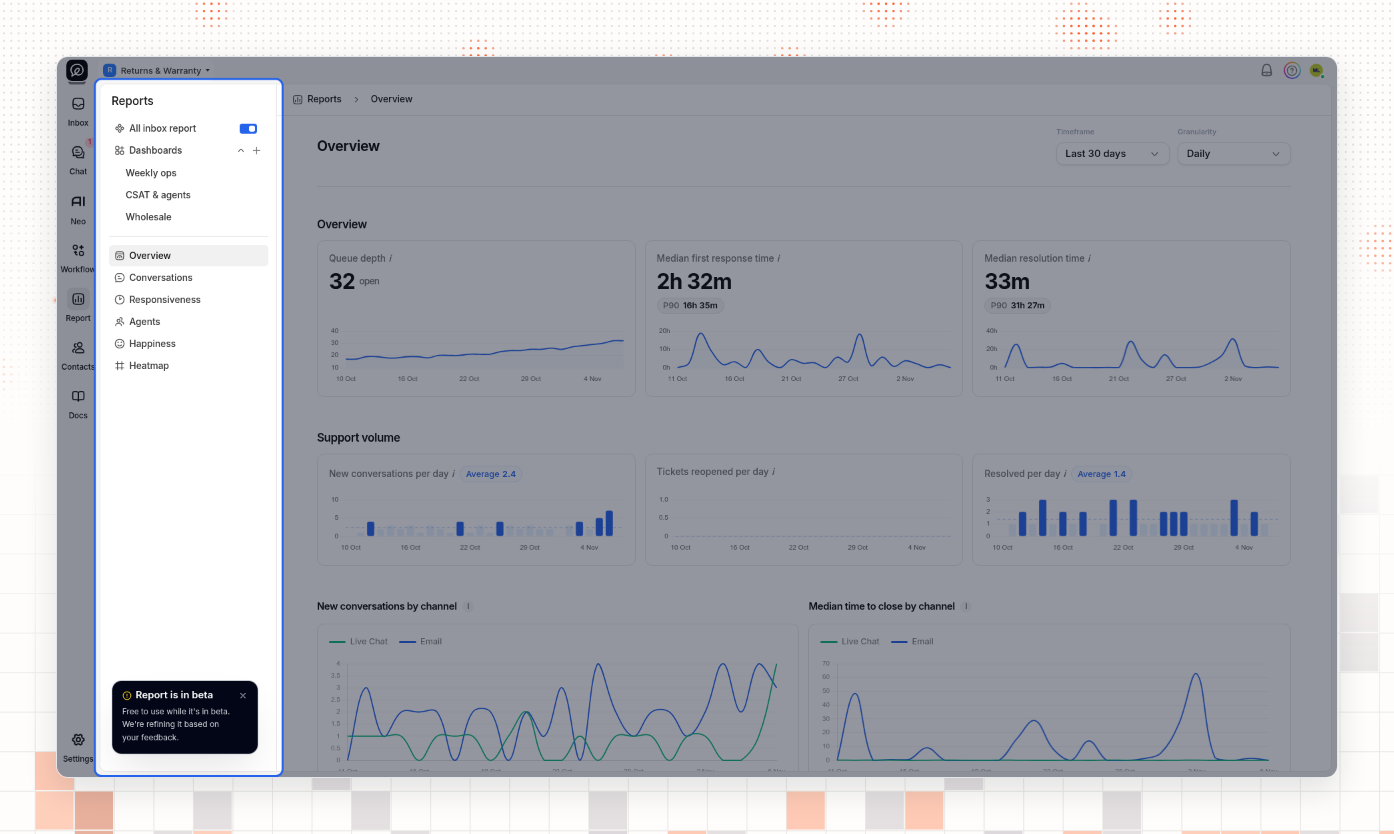
Select a page: Overview, Conversations, Responsiveness, Agents, Happiness, or Heatmap.
To report on all your inboxes, turn on All inbox report. When the switch is off, the reports show only the inbox that is selected at the top left of the screen. The switch turns off again when you reload the page.
The Account Owner sees every inbox. Other teammates see only the inboxes they are an agent on, also when All inbox report is on.
Pick a timeframe and a granularity
The Timeframe and Granularity lists are at the top right of each page. Your choice stays the same when you go to another report page or a dashboard.
Open Timeframe and choose Last 24 hours, Last 7 days, or Last 30 days. Each option shows its dates. Last 30 days is the default.
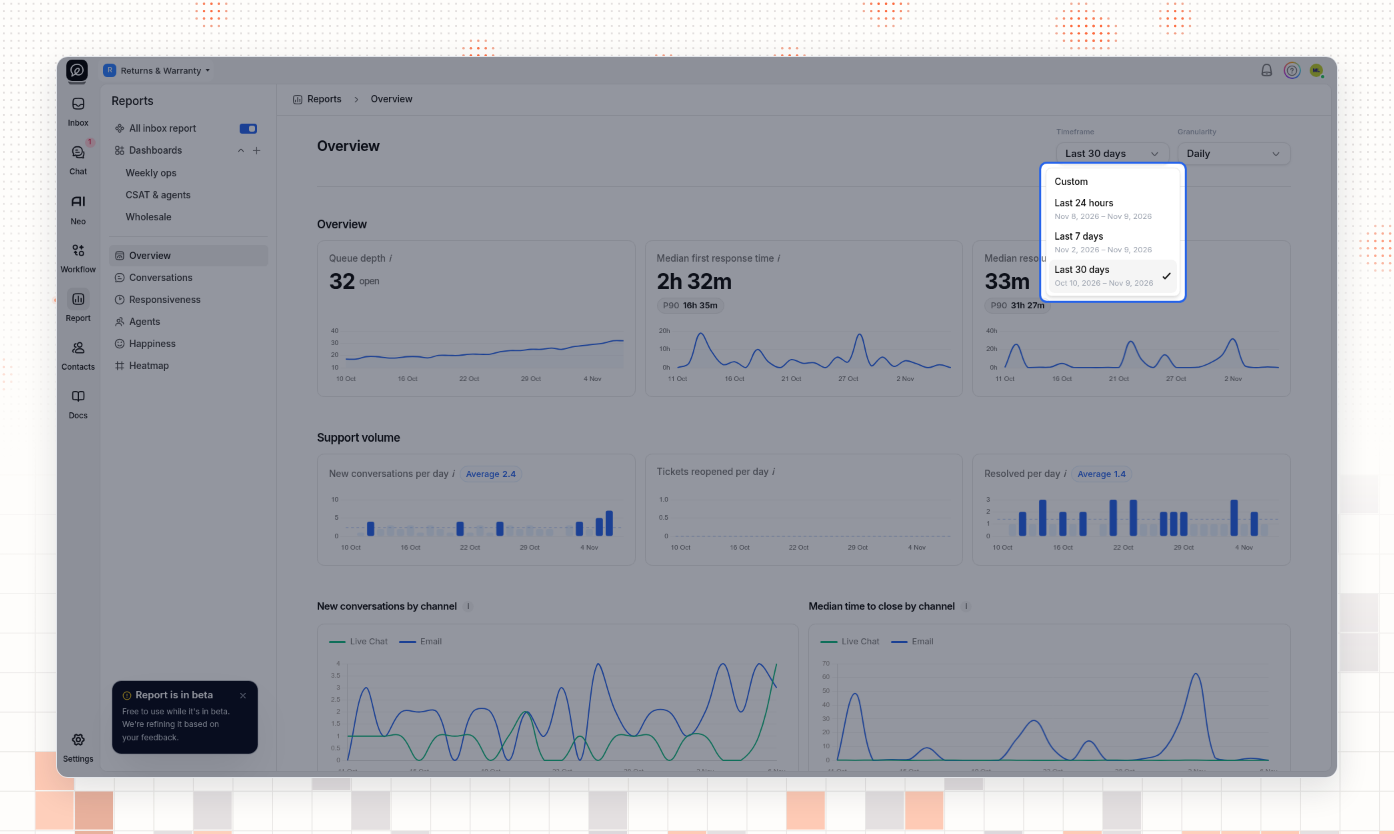
To choose your own dates, select Custom. In the calendar, select the first day, then the last day, and select Apply. You cannot select a day after today. After Apply, the Timeframe list opens again. Press Esc to close it.
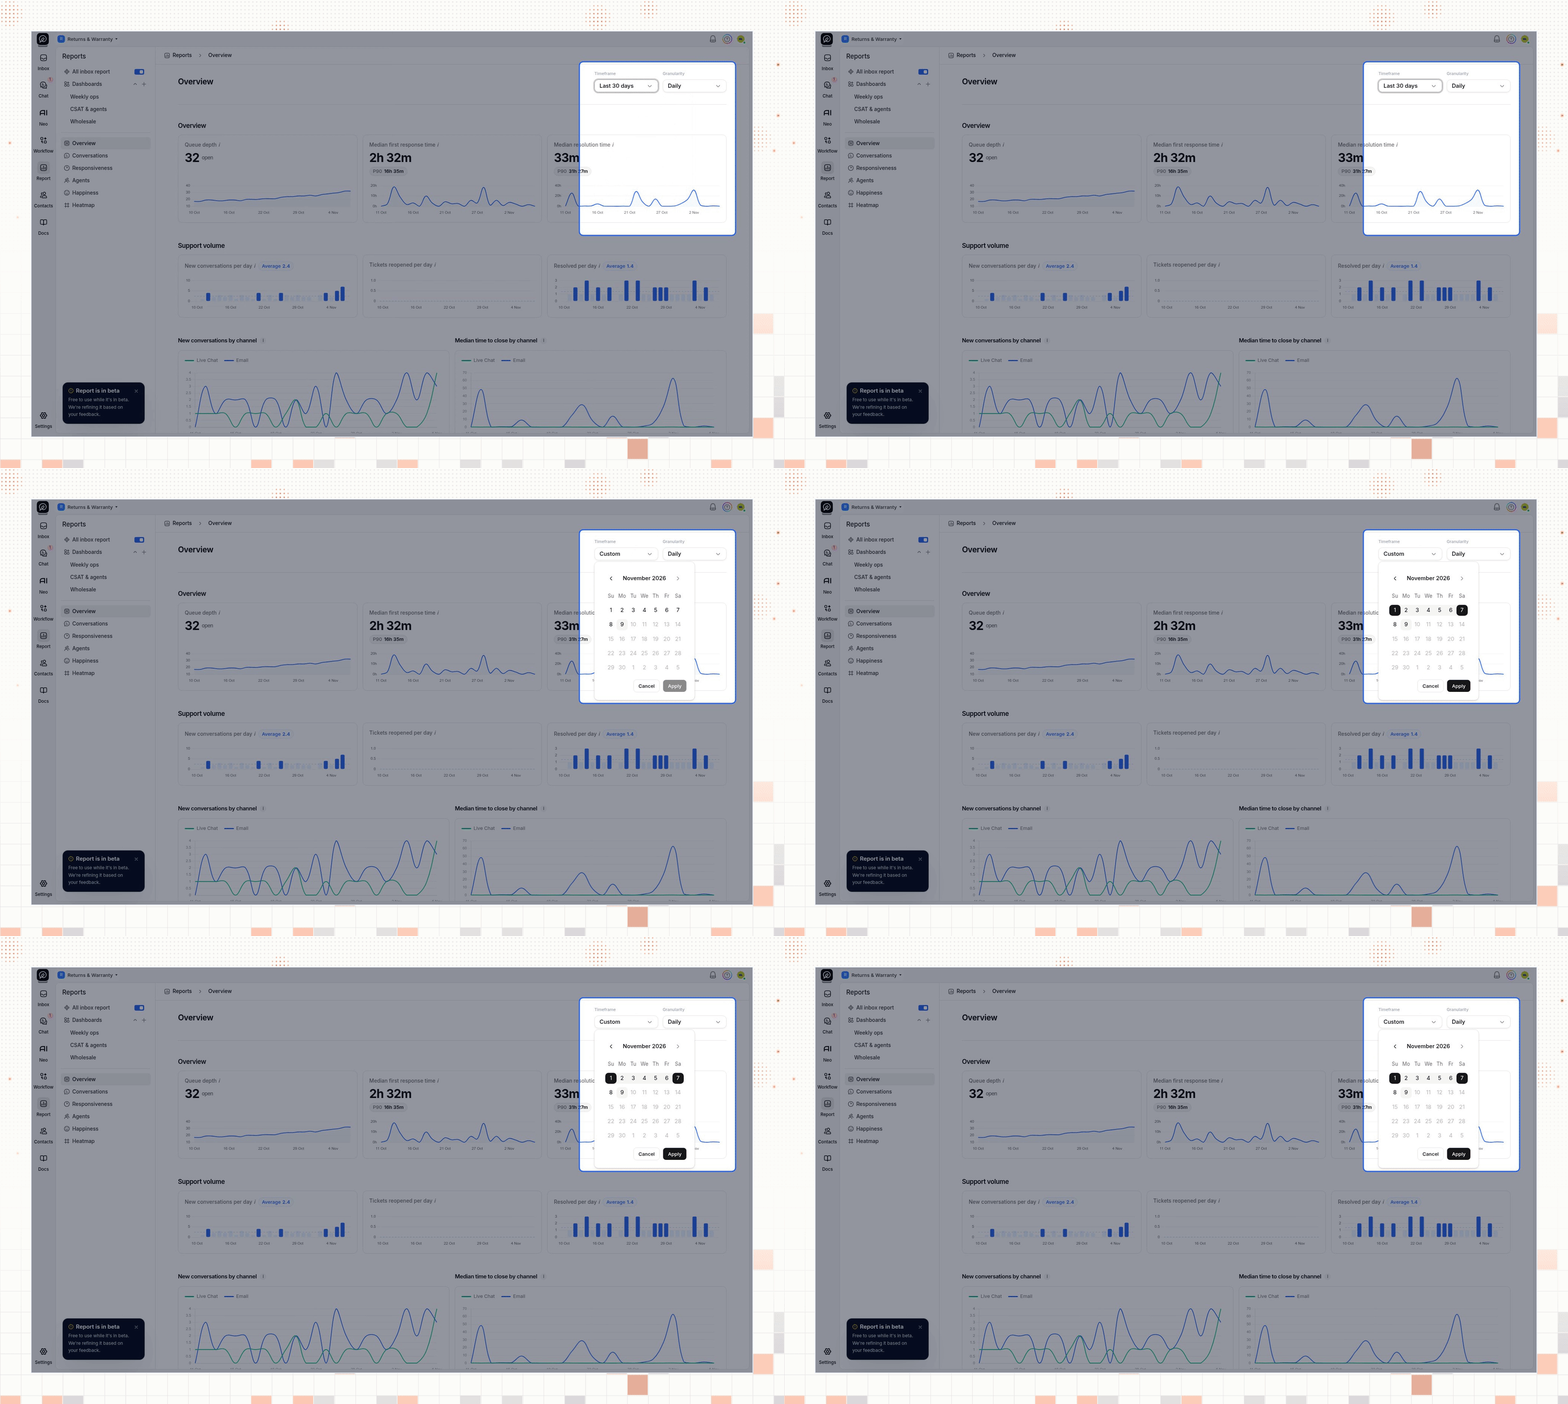
Open Granularity and choose how to group the charts: Hourly, Daily, Weekly, or Monthly. Daily is the default. The Heatmap page has no Granularity list.
Timeframe | Granularities you can choose |
|---|---|
Last 24 hours | Hourly |
Last 7 days | Hourly, Daily |
Last 30 days | Hourly, Daily, Weekly |
Custom, more than 30 days | Hourly, Daily, Weekly, Monthly |
A shorter custom timeframe has the same limits as the fixed timeframe of the same length.
Read the report pages
Each chart has an i icon next to its name. Point to the icon to read how ThriveDesk calculates the number. Times show in hours and minutes, for example 2h 32m or 47m. P90 is the time that 90 percent of the measured conversations or replies stay within.
Overview
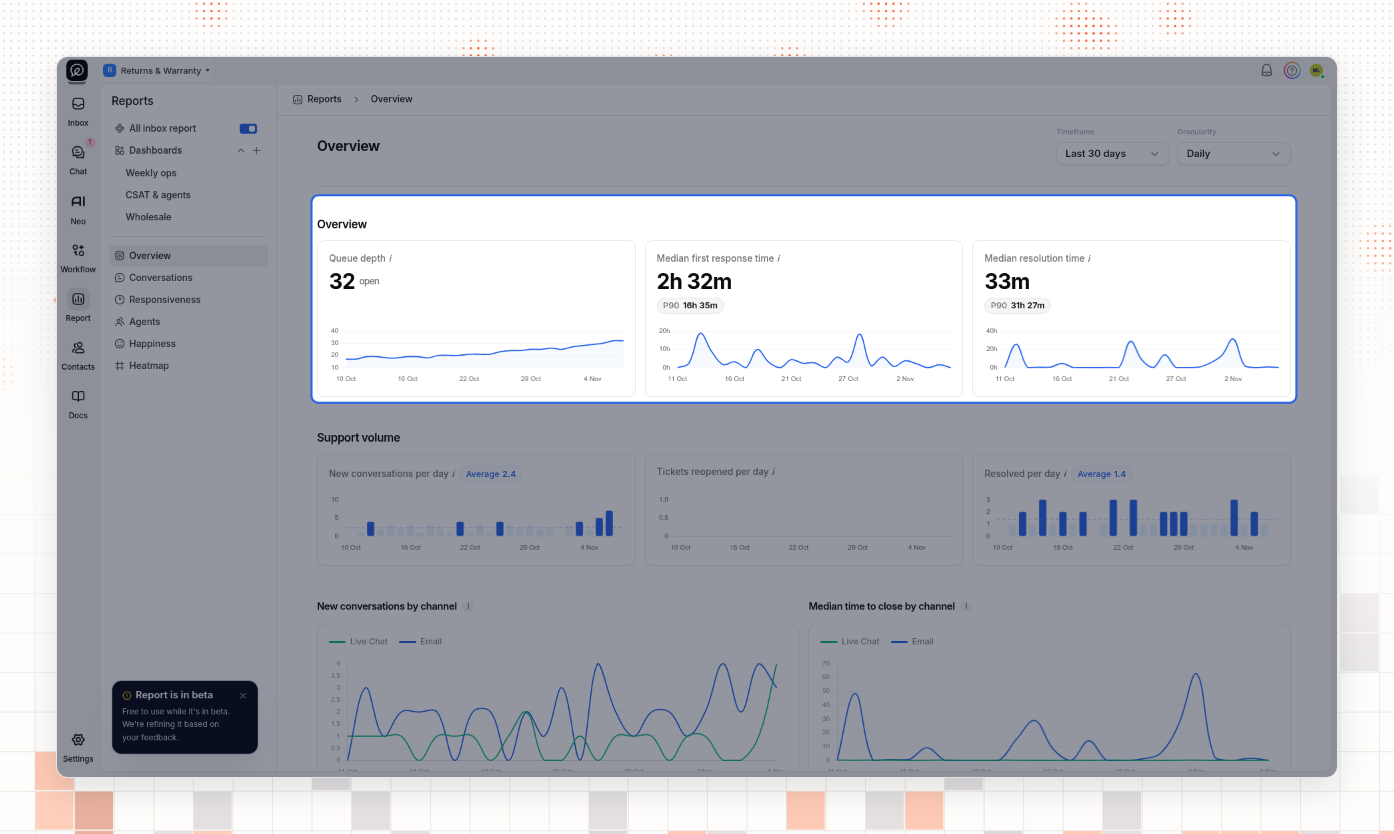
The Overview page puts the main numbers on one page.
Section | What it shows |
|---|---|
Overview | Queue depth: open conversations that are not snoozed, at the end of the period. Median first response time: from a new conversation to the first agent reply. Median resolution time: from a new conversation to its last close. |
Support volume | New, reopened and resolved conversations per day, with the average. |
New conversations by channel, Median time to close by channel | The same numbers for Email and Live Chat. |
Customer experience | CSAT score: the percent of ratings that are great. Customer waiting time: the median first response time. |
Agent performance | Median first response, response and close times for the team. A chart and a table show the five fastest agents for the metric you choose, Time to close by default. Select View all agents to see all of them. |
First response time | The median first response time over the period. |
When the period has no activity, the page shows No data yet. Choose a longer timeframe.
Conversations
The Conversations page counts your conversations.
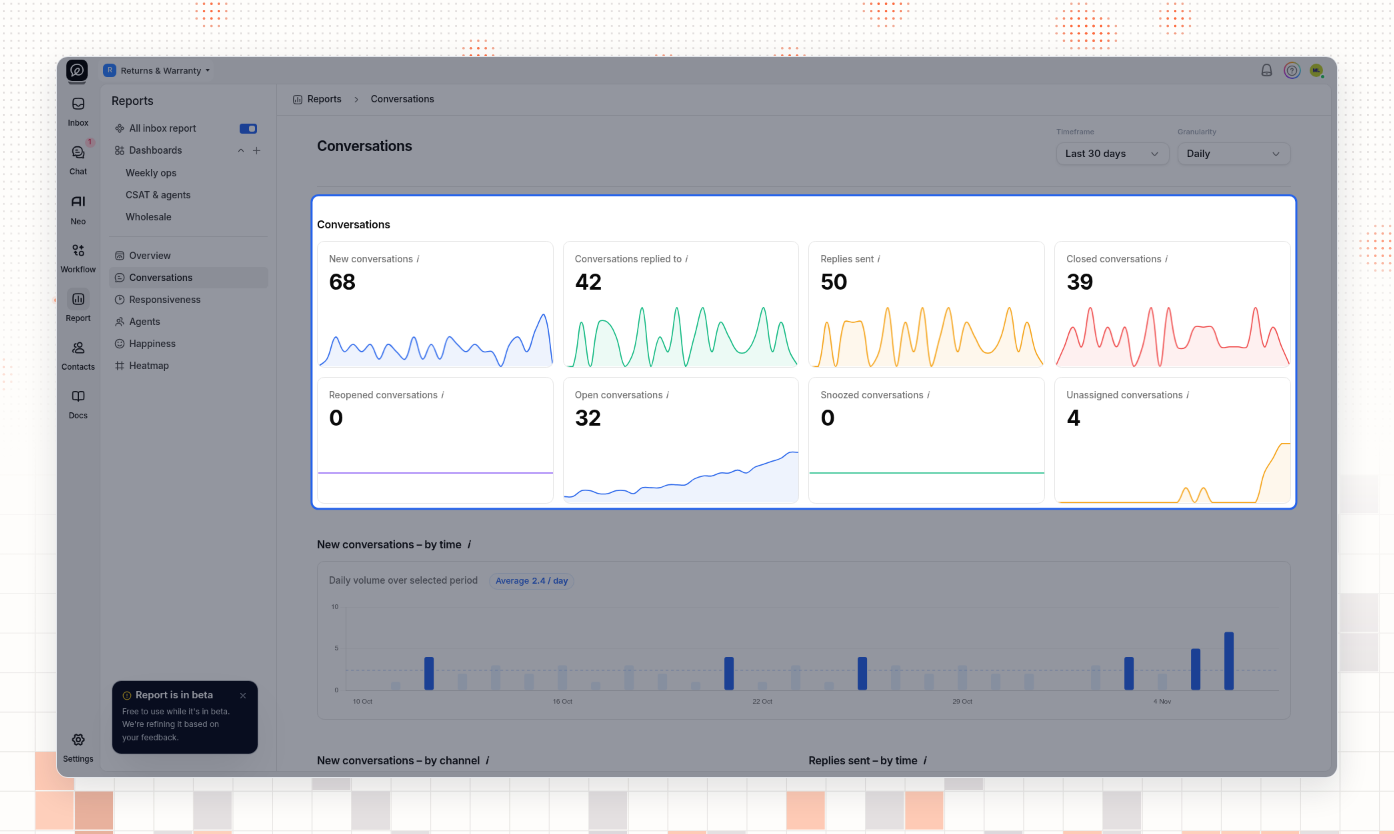
The cards show the new, replied-to, closed and reopened conversations, and the replies sent, in the period. Open conversations, Snoozed conversations and Unassigned conversations count conversations at the end of the period. Below the cards, charts show each number over time, by channel, and by hour of the day.
Responsiveness
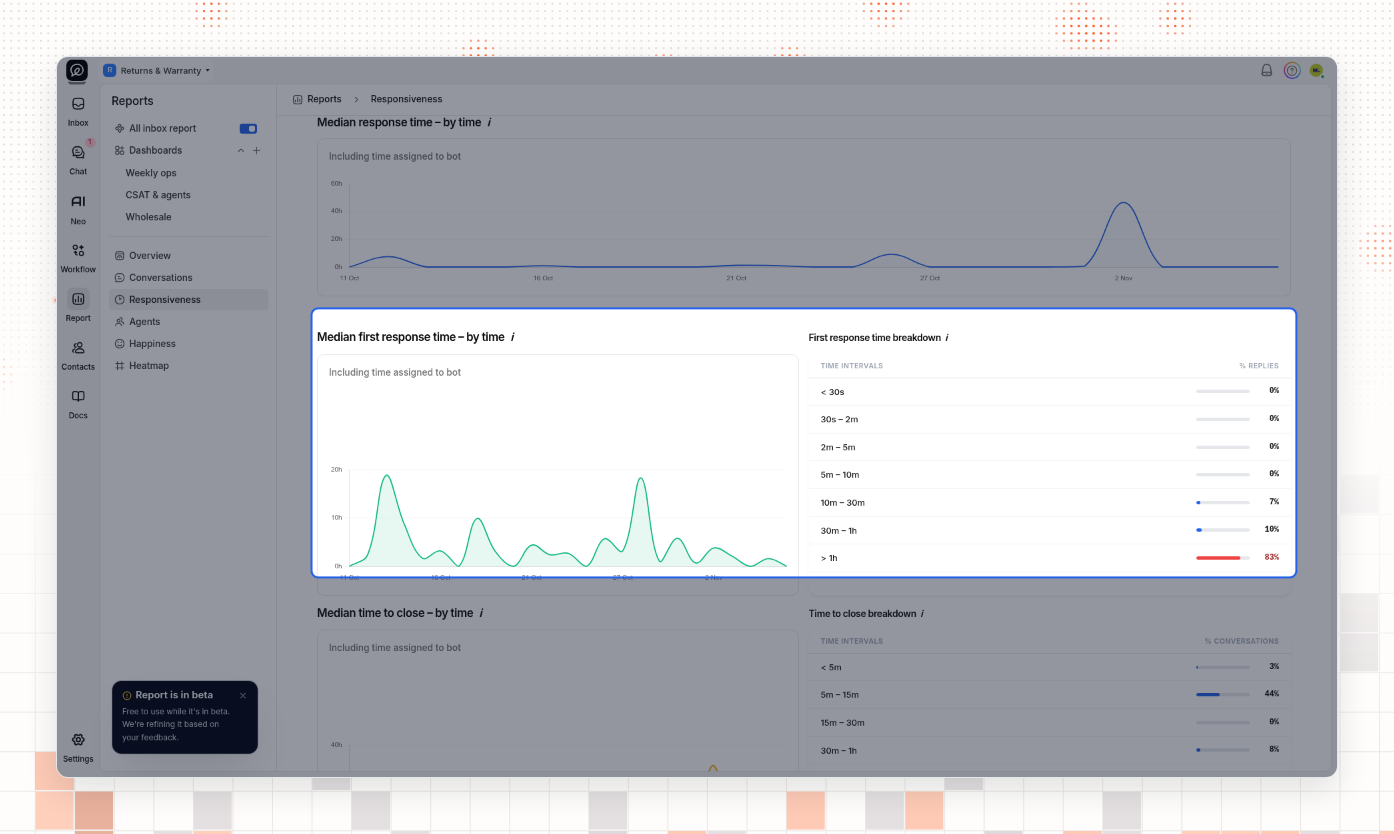
The Responsiveness page shows how fast your team replies and closes.
Median response time: from each customer message to the first agent reply after it.
Median first response time: from a new conversation to the first agent reply.
Median time to close: from a new conversation to its last close.
The First response time breakdown and Time to close breakdown tables put each conversation in a time band, for example 10m – 30m or > 1h, and show the percent in each band.
Agents and the Agent report
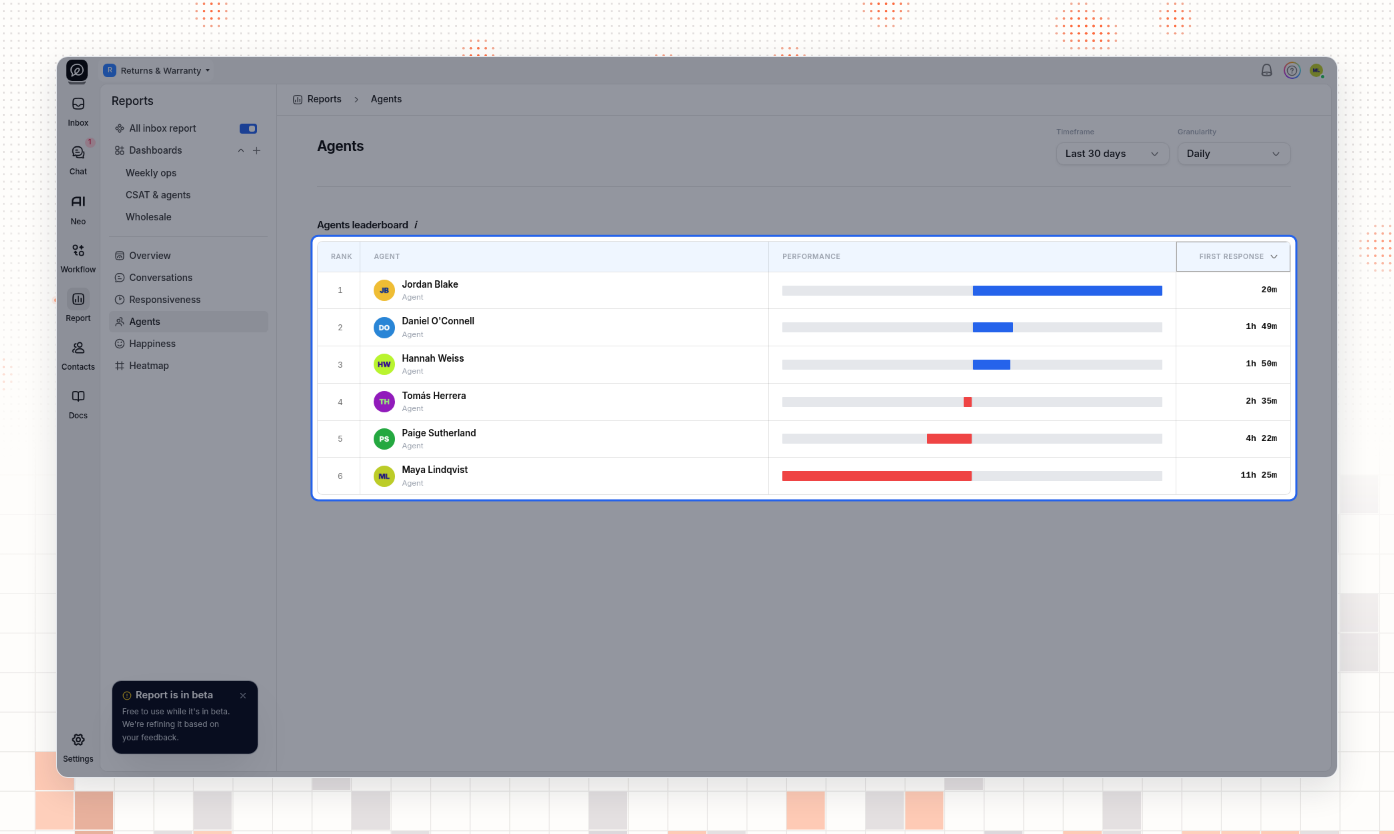
The Agents page ranks your agents. Choose the metric in the list at the top of the last column: First response, Time to close, or Response time. The fastest agent is first. A blue bar means faster than the team median. A red bar means slower.
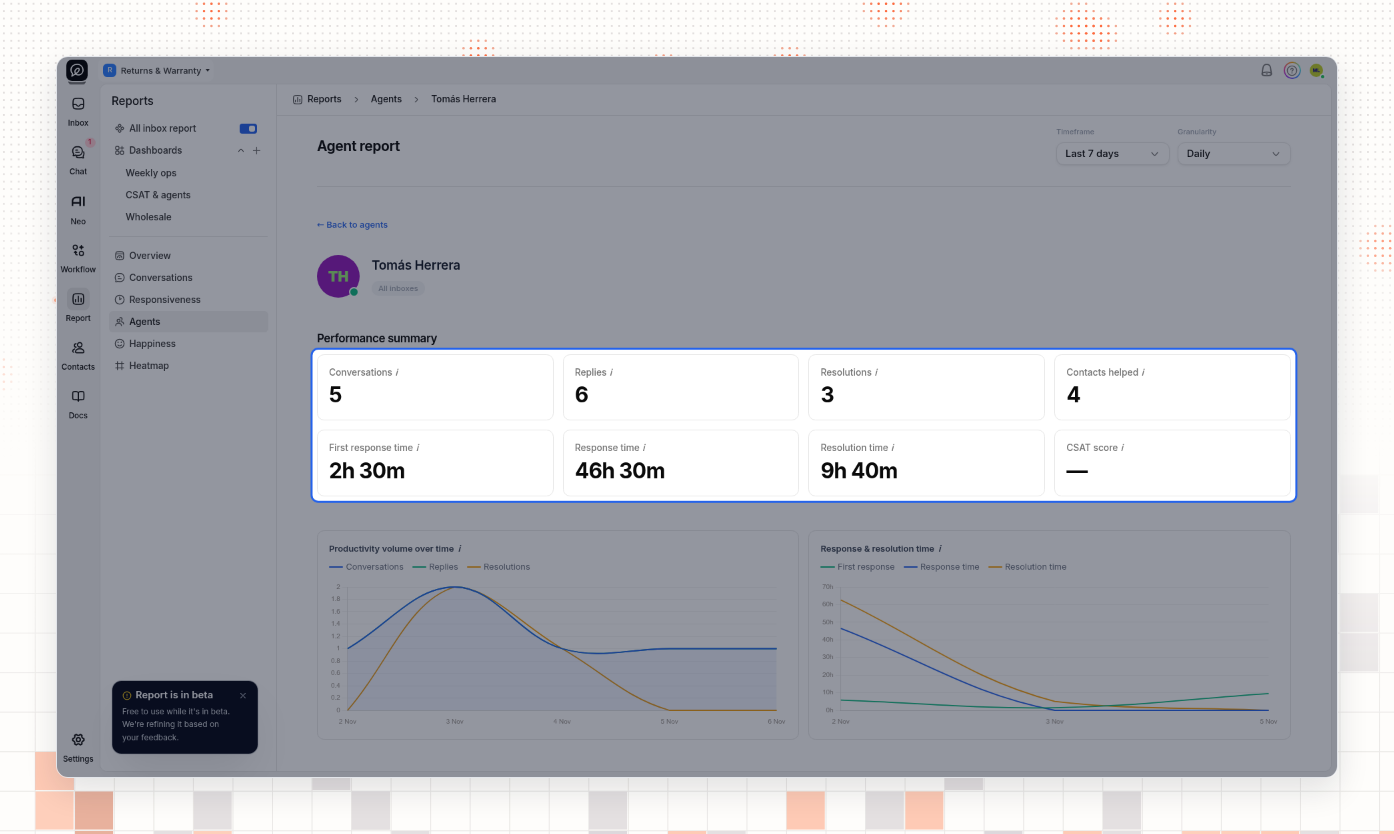
Select an agent's name to open the Agent report. It shows that agent's conversations, replies, resolutions, customers helped, response and close times, and CSAT score. Charts show the agent's work over time. Recent customer ratings lists the ratings the agent received. Select ← Back to agents to return.
Happiness
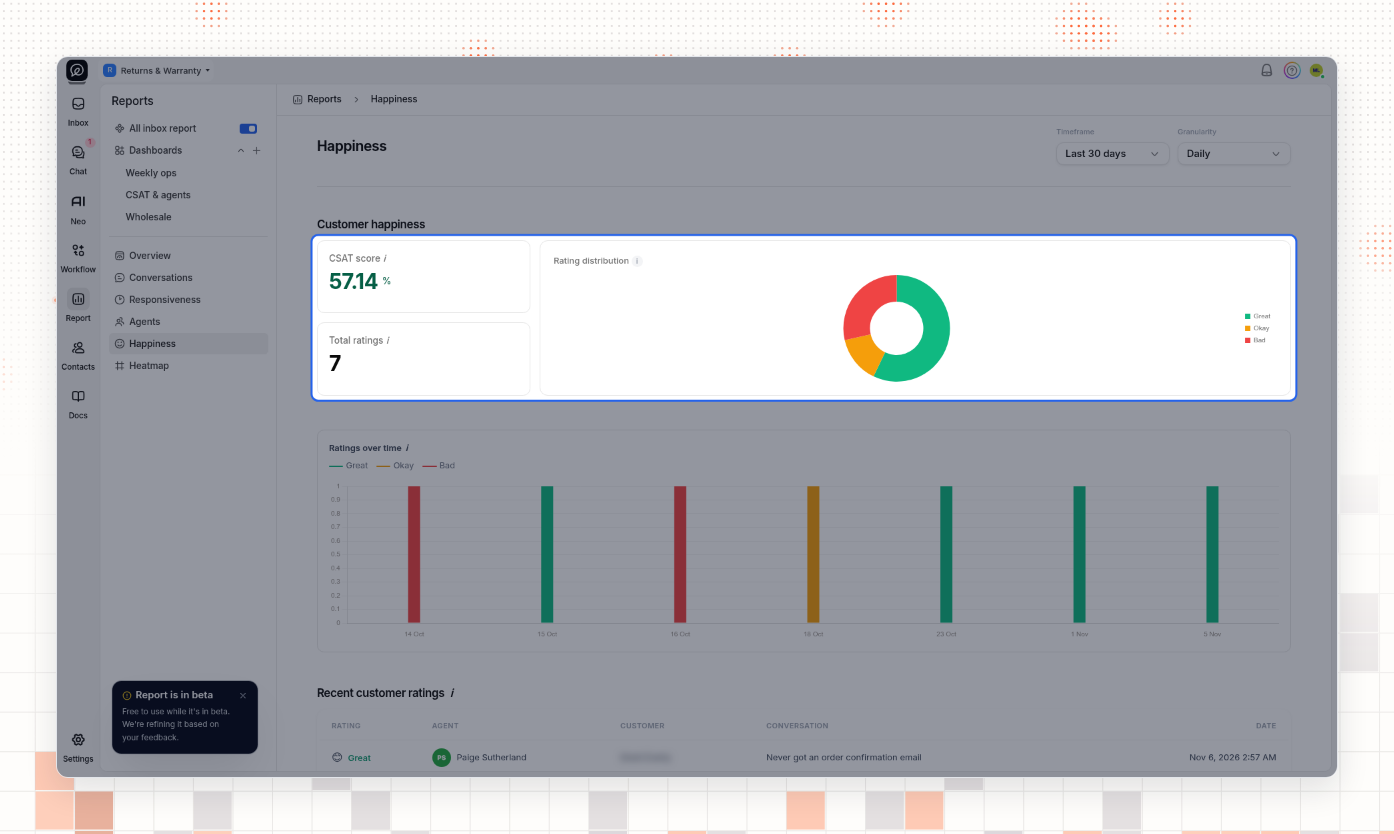
The Happiness page shows your customer ratings. CSAT score is the percent of ratings that are great. Rating distribution splits the ratings into Great, Okay and Bad. Recent customer ratings lists each rating with the agent, the customer, the conversation and the date.
Heatmap
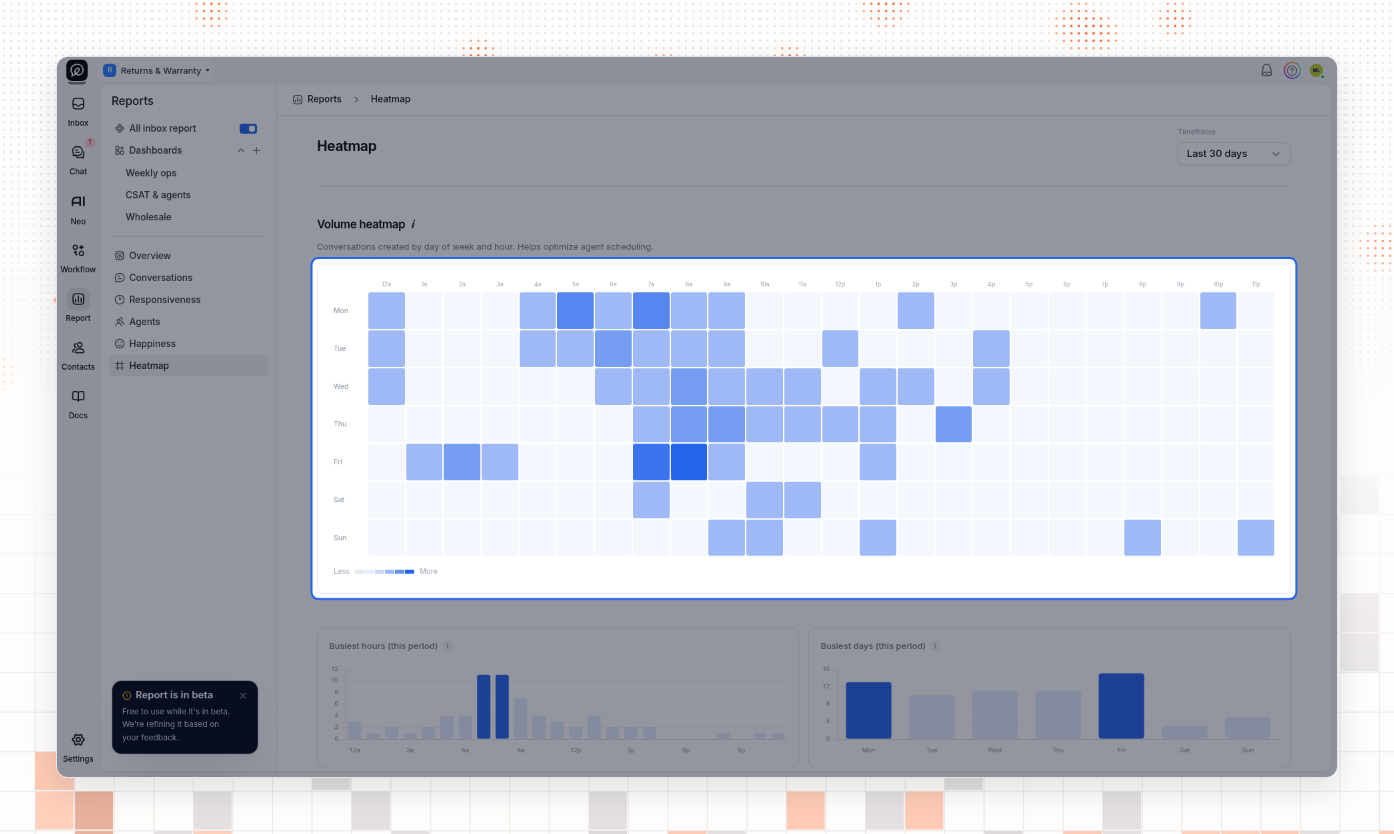
The Heatmap page shows when new conversations arrive, by day of the week and hour. A darker square means more conversations. Busiest hours and Busiest days show the same counts as bars.
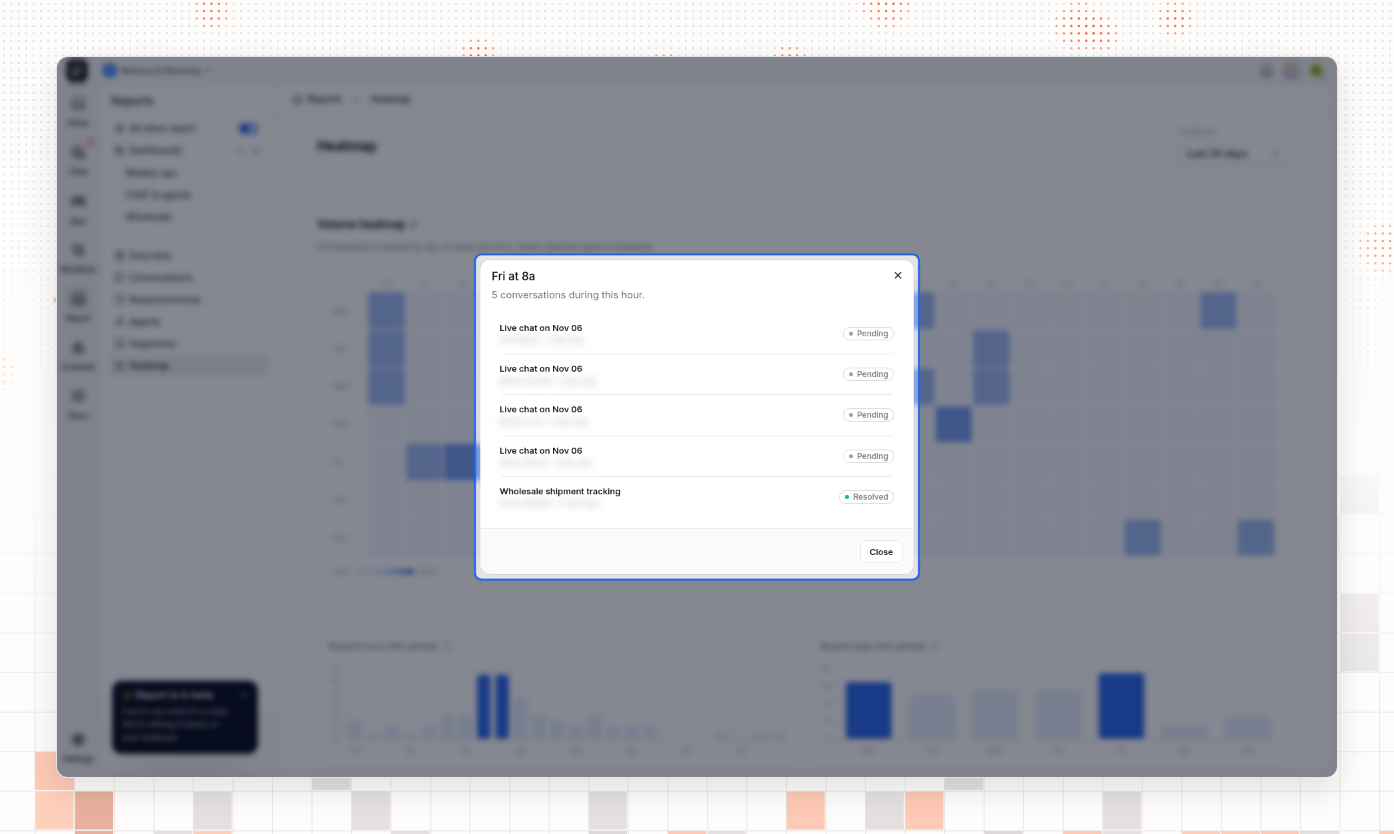
To see the conversations behind a square, select the square. A window lists each conversation with its status. Select a conversation to preview it. Select Close to close the window.
Build a custom dashboard
A dashboard shows the charts you choose from all the report pages, on one page.
Create a dashboard
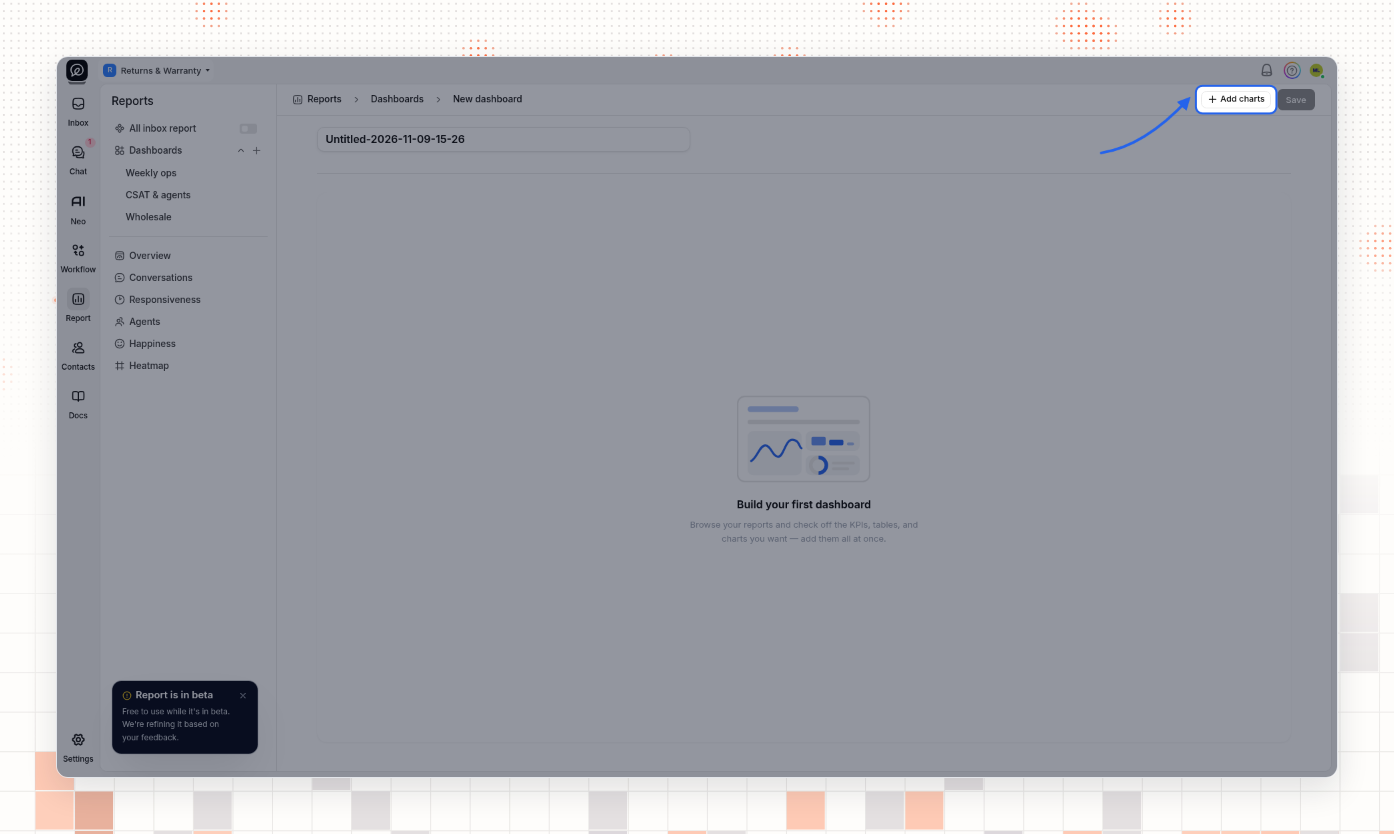
In the Reports sidebar, select + next to Dashboards. A new dashboard opens.
Type a name in the name box at the top. Until you change it, the name is Untitled- followed by the date and time.
Select Add charts.
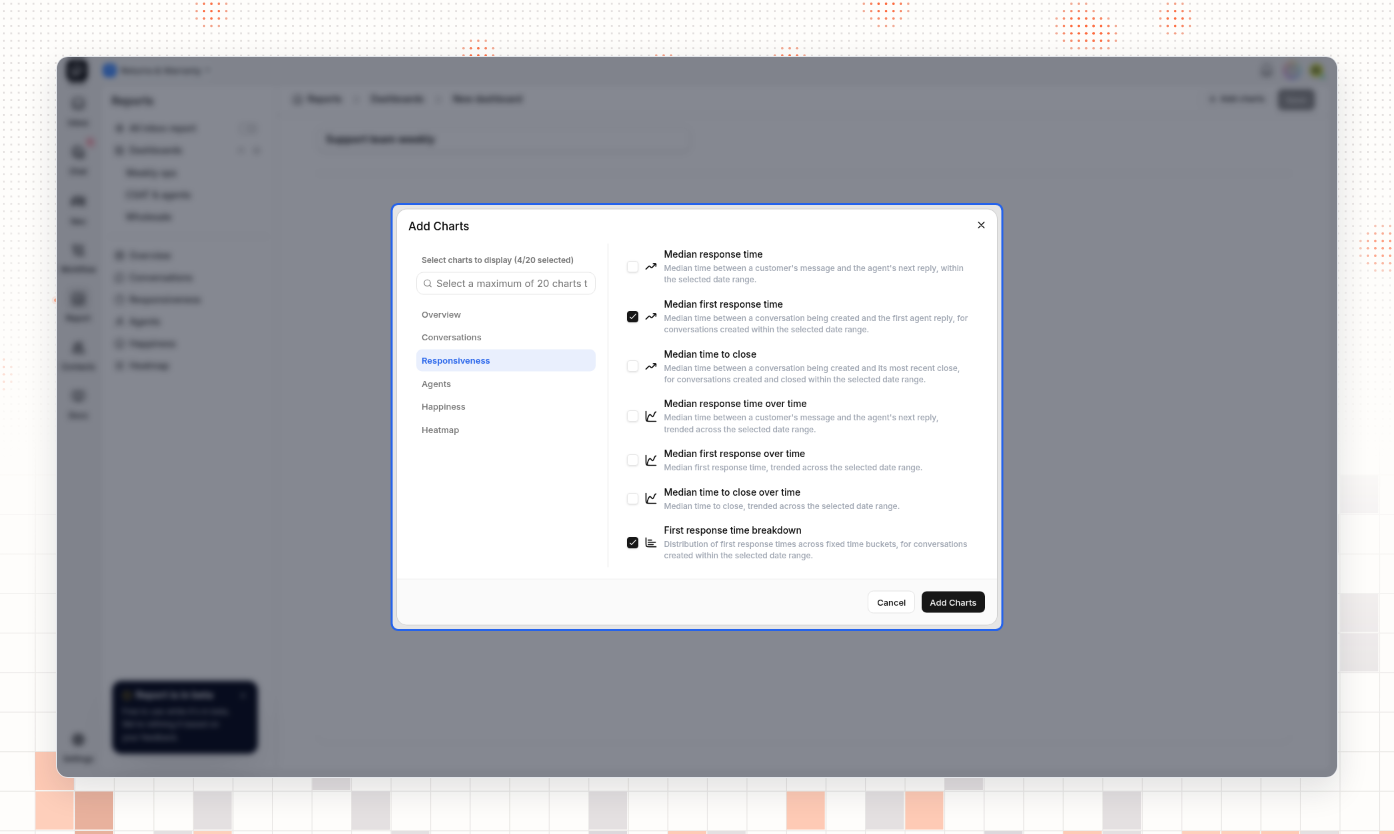
In the Add Charts window, select a report on the left, then select the charts you want. To find a chart, type its name in the search box. You can add up to 20 charts.
Select Add Charts. The charts appear on the dashboard in a fixed order, not in the order you selected them. You cannot move a chart.
Select Save. The message Dashboard saved appears, and the dashboard shows in the sidebar under Dashboards.
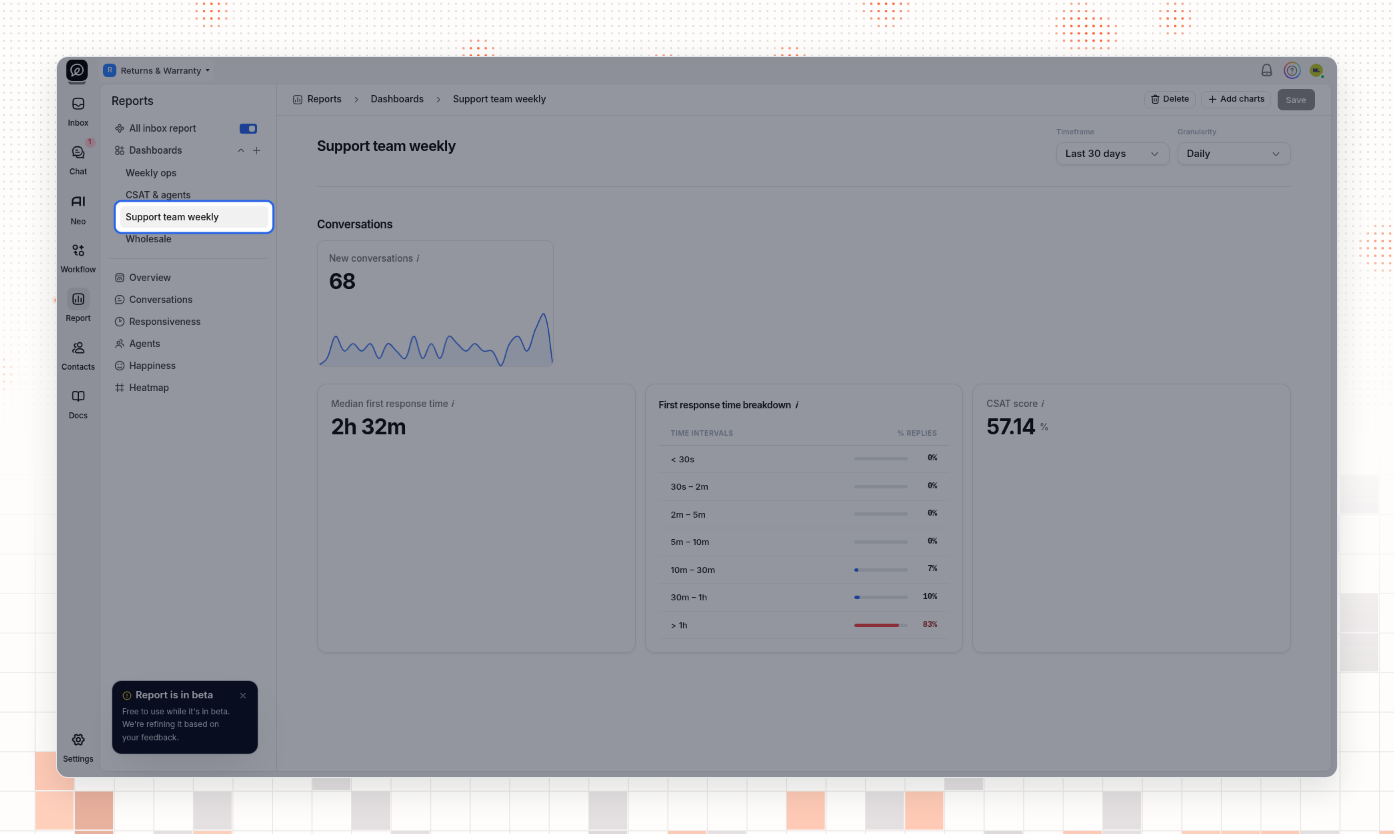
A dashboard uses the Timeframe, Granularity and All inbox report settings that are on the screen. Opening a dashboard does not change them.
Rename a dashboard or change its charts
In the sidebar, select the dashboard. Wait until the charts show. A change you make while the page shows Loading dashboard… is lost when the charts load.
To rename it, select the pencil next to the name, type the new name, and press Enter.
To add or remove charts, select Add charts, select or clear the charts, and select Add Charts.
Select Save.
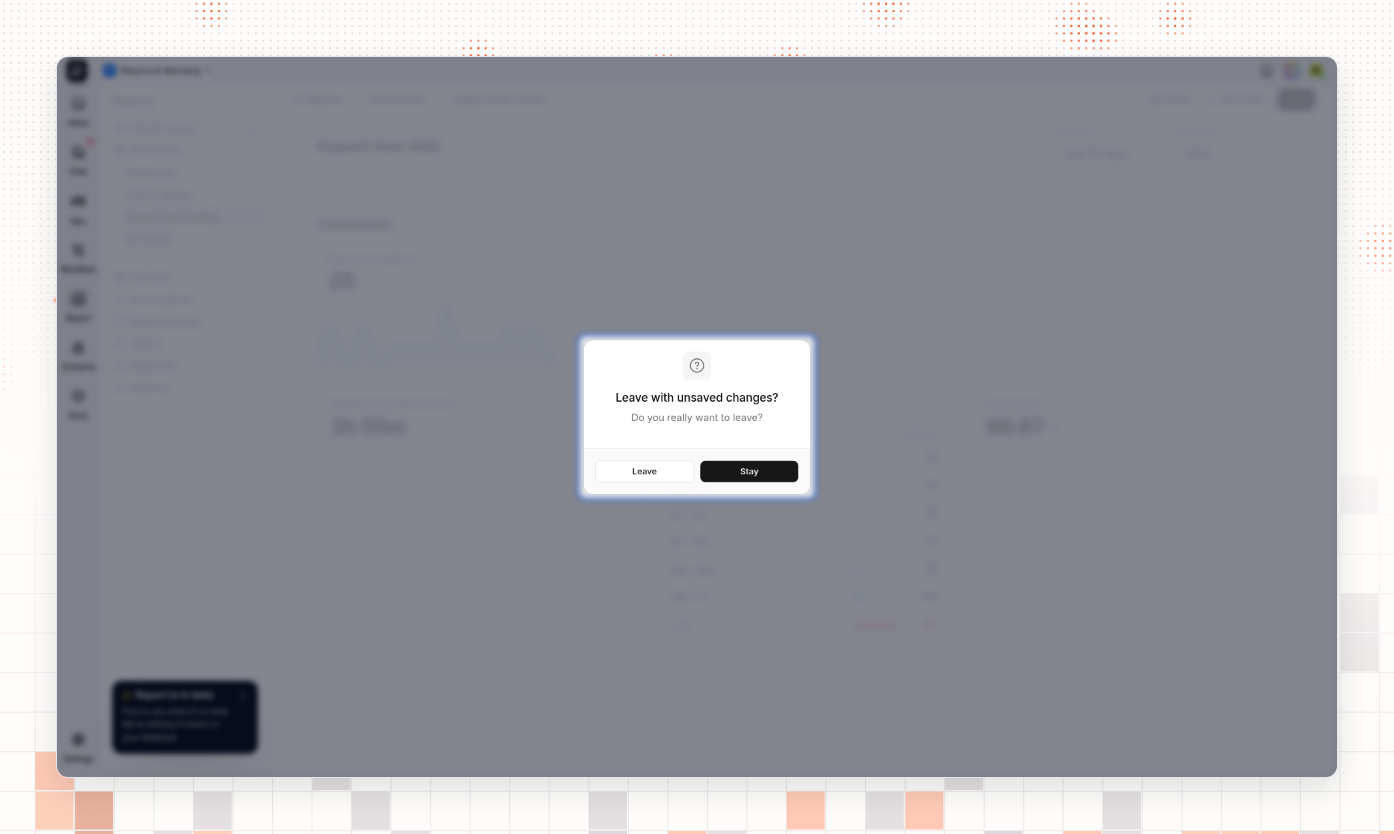
If you leave the dashboard before you save, ThriveDesk asks Leave with unsaved changes?. Select Stay to go back and save, or Leave to discard your changes.
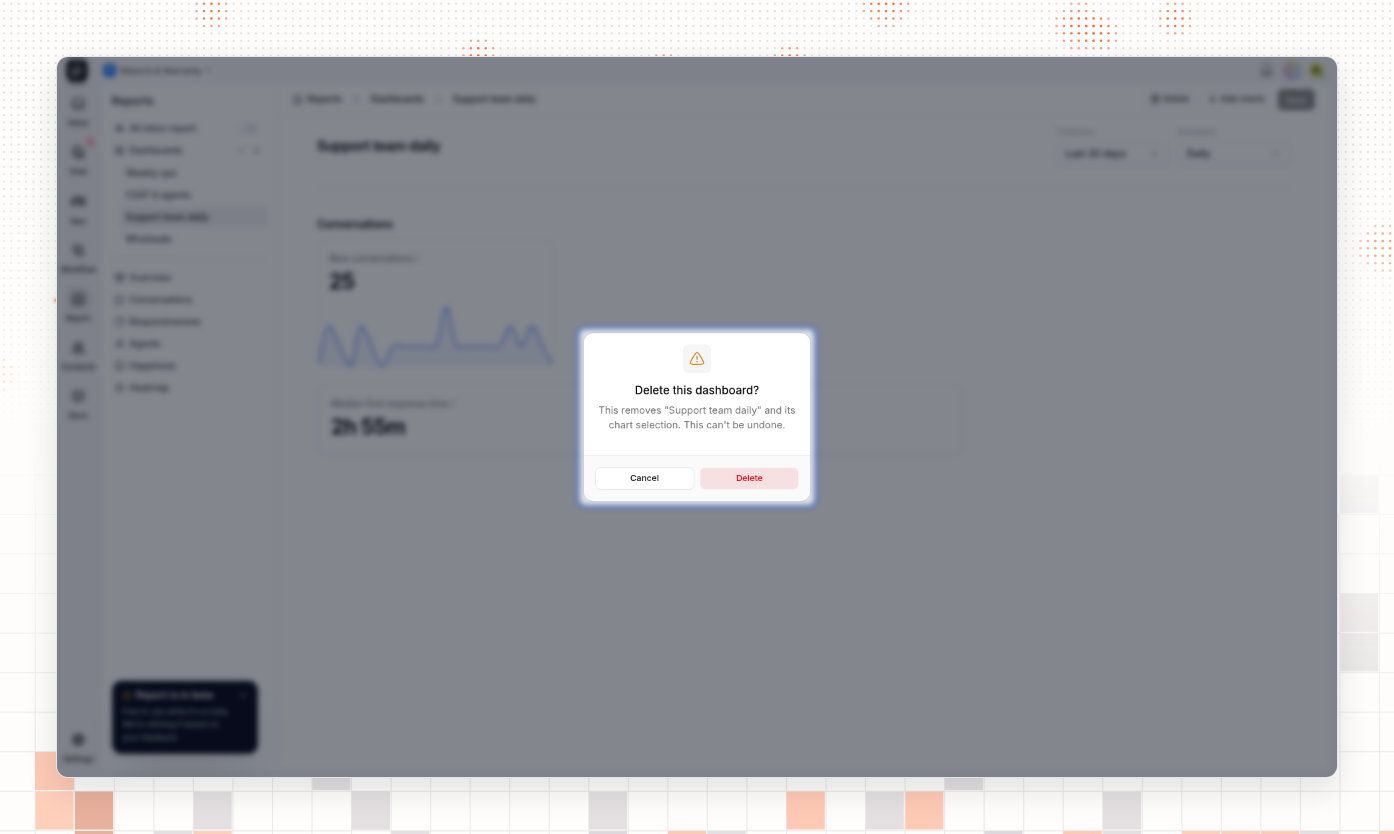
Delete a dashboard
In the sidebar, select the dashboard.
Select Delete.
In Delete this dashboard?, select Delete.
Who can open Reports
The Account Owner can always open Reports. Other teammates need the Reports Read capability, in the Reports category of Settings → Roles & Permission. The Administrator role has it by default. The User role does not.
A teammate without Reports Read does not see Report in the left rail. When that teammate opens a Reports address, ThriveDesk shows You do not have permission to view this page.
What you should see
Each report page shows numbers and charts for the timeframe you chose. After you save a dashboard, the message Dashboard saved appears and the dashboard is listed under Dashboards in the sidebar.
Common problems
Symptom | Cause | Fix |
|---|---|---|
Report is missing from the left rail, or a Reports page shows You do not have permission to view this page | You do not have the Reports Read capability | Ask the Account Owner or an Administrator to give you Reports Read |
A page shows Couldn't load report after you choose Hourly | A custom timeframe longer than 41 days has too many hours to draw | Choose Daily, Weekly or Monthly, or a shorter timeframe |
An agent shows 0h 00m for a time | There is no data for that time in the period, for example no customer message that the agent answered | Choose a longer timeframe. 0h 00m does not mean an instant reply |
Save shows Failed to save dashboard, and the dashboard shows Couldn't load this dashboard | You already have a dashboard with the same name | Type a different name and select Save again |
Questions
Does a dashboard remember its own timeframe?
No. A dashboard uses the timeframe and granularity that are selected on the screen. When you open a dashboard, change the timeframe to the period you want to see.
Can I share a dashboard with my team?
Not from the app. A dashboard you create is visible only to you. Each teammate with Reports Read can create their own dashboards.
Do reports count spam?
No. Reports leave out conversations that are marked as spam.
Related
Set roles and permissions — to give a teammate the Reports Read capability.
Set up business hours — business hours control auto replies and automations. They do not change the response and close times in Reports.
Block spam and unwanted senders — conversations marked as spam are not counted in Reports.
Last verified: 2026-11-09